Blood sugar chart and log for adults with diabetes: Record glucose readings alongside meals, medicines, activity and symptoms so you can spot patterns worth discussing with your diabetes care team.
Written by: Dr. Albana Greca, MD, MMedSc • Medically reviewed by: Dr. Ruden Cakoni, MD, Endocrinologist
Last medically reviewed: July 2026
Quick Answer
A blood sugar chart shows how your readings change over time. Record when you checked, whether the reading was fasting or after a meal, and any activity, medicine or symptoms that may explain it. Compare readings taken in similar circumstances. One unusual number rarely explains the whole pattern; severe symptoms or a low glucose reading still require prompt action.
A chart can help guide a discussion about treatment. Change insulin or other diabetes medicine only according to your individualized written plan or after reviewing the pattern with your prescribing clinician.
Use the Interactive Blood Sugar Chart
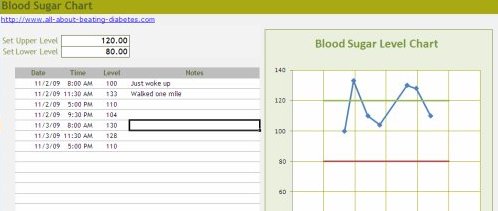
Enter up to 30 readings, view the trend, and export a copy for your next appointment. You can also use the Excel blood sugar chart or printable PDF blood sugar log. The chart is an organizational tool; it does not diagnose diabetes or calculate medication doses.
Entries are saved in this browser and can be exported as a CSV file. Avoid entering names or other identifying information in the note field. Clearing browser data may erase the entries.
| Date/time | Reading | Timing | Note | Remove |
|---|---|---|---|---|
| No readings entered yet. | ||||
Reference lines are optional and apply across every point on this chart. Use them only for readings taken under comparable conditions and with targets agreed with your clinician. For mixed fasting, before-meal, and after-meal readings, leave them blank.
How to use the chart: Enter the reading in mg/dL or mmol/L, choose its timing, and add a short note if it helps explain the result. The chart displays results in mg/dL and lists both units in the table. Points are plotted in date order at equal spacing, so the horizontal distance does not represent elapsed time. Keep the timing labels visible when reviewing mixed readings.
What Should You Record?
- Date, time, glucose value and unit.
- Whether it was fasting, before a meal, one or two hours after starting a meal, bedtime, overnight or during symptoms.
- Food or carbohydrate intake, relevant medicines or insulin, exercise, illness and symptoms when useful.
- Any low reading, treatment given, and the follow-up value.
Common Treatment Targets: Use the Right Context
These are general targets for many nonpregnant adults who already have diabetes. Your clinician may set different goals based on your medicines, hypoglycemia risk, age and overall health.
| Situation | Common reference | What to remember |
|---|---|---|
| Before meals | 80–130 mg/dL (4.4–7.2 mmol/L) | A common treatment target, not a diagnostic fasting range. |
| Peak after meals, generally checked 1–2 hours after the start of a meal | Below 180 mg/dL (below 10.0 mmol/L) | Do not apply this upper limit to every before-meal reading. |
| Low-glucose alert | Below 70 mg/dL (below 3.9 mmol/L) | Follow your personal low-glucose treatment plan promptly. |
| Bedtime or overnight | Individualized | Discuss an appropriate goal if you use insulin or are at risk of overnight lows. |
Laboratory tests used to diagnose prediabetes and diabetes follow different rules from home monitoring. The normal blood sugar level chart compares diagnostic ranges and treatment targets; blood sugar levels by time of day explains how timing changes the meaning of a reading.
How to Recognize a Pattern
Morning readings are repeatedly high
Compare several mornings and, when your care plan calls for it, overnight values. Late meals, illness, stress, medicines and the dawn phenomenon are possible contributors. A chart alone cannot tell you which one caused the rise. The fasting glucose guide explains how laboratory fasting results differ from daily monitoring.
Readings rise after particular meals
Compare meals measured at the same interval after eating, and note carbohydrate portions, activity and medication timing. The after-meal blood sugar guide gives more context for these results.
Lows follow exercise or occur overnight
Record activity, medicines, symptoms and treatment. People who use insulin or medicines that can cause hypoglycemia should discuss repeated lows promptly with their care team.
The average looks fine, but readings swing widely
Bring the actual readings and their timing to your appointment. An average can hide alternating highs and lows; a single chart line that mixes fasting and after-meal points also needs careful interpretation.
What to Do With a Reading Outside Your Plan
If a result seems inconsistent with how you feel, wash and dry your hands and repeat a finger-stick check when appropriate. If you use a CGM, follow its instructions for confirming results that do not match symptoms. Follow your written correction or sick-day plan for high readings; contact your care team when readings repeatedly exceed your personal action threshold. Do not guess an insulin dose from a general chart.
For a conscious adult able to swallow, a common approach to glucose below 70 mg/dL is 15 grams of fast-acting carbohydrate, another check after 15 minutes, and repeating treatment if it remains below 70 mg/dL. Follow your own plan where it differs. Severe confusion, seizure, unconsciousness or inability to swallow safely calls for glucagon if available and emergency assistance; never give food or drink by mouth to an unconscious person.
Share a Useful Summary With Your Clinician
Export the chart or bring your log with the dates covered, your agreed targets, repeated fasting or after-meal patterns, lows and their treatment, illness, medicines and questions. One or two weeks of focused readings may answer a specific question; your clinician may ask for a different schedule. Pregnancy, childhood and frailty require individualized monitoring plans.
Dr. Albana’s Note
When I review a glucose chart, I first separate readings by the circumstances in which they were taken. A fasting value and an after-meal value may sit next to each other on a line, but they answer different questions. The useful question is: What keeps happening, and what do we need to check next?
Frequently Asked Questions
Can a blood sugar chart diagnose diabetes?
No. It can show a pattern worth investigating, but diagnosis uses appropriate laboratory testing and clinical assessment.
Should I change insulin after seeing a high chart point?
Use only your prescribed correction or titration plan. If you have no written plan or high readings recur, contact your prescribing clinician.
Why are the chart’s reference lines optional?
Before-meal and after-meal targets differ. One pair of lines cannot accurately classify a chart that combines several types of reading.
Will my entries be available on another device?
No automatic sync is provided by this chart. Export a CSV to keep a copy; clearing browser data may remove saved entries.
Related Resources
- Normal blood sugar level chart: diagnostic ranges and treatment targets
- How to interpret readings at different times of day
- Dangerous blood sugar levels and warning signs
References
- American Diabetes Association. Glycemic Goals, Hypoglycemia, and Hyperglycemic Crises: Standards of Care in Diabetes—2026.
- NIDDK. Diabetes Tests & Diagnosis.
- CDC. Diabetic Ketoacidosis.
Educational information and charting tools do not replace personal medical advice, diagnosis or emergency care.